Component-defined Visualization
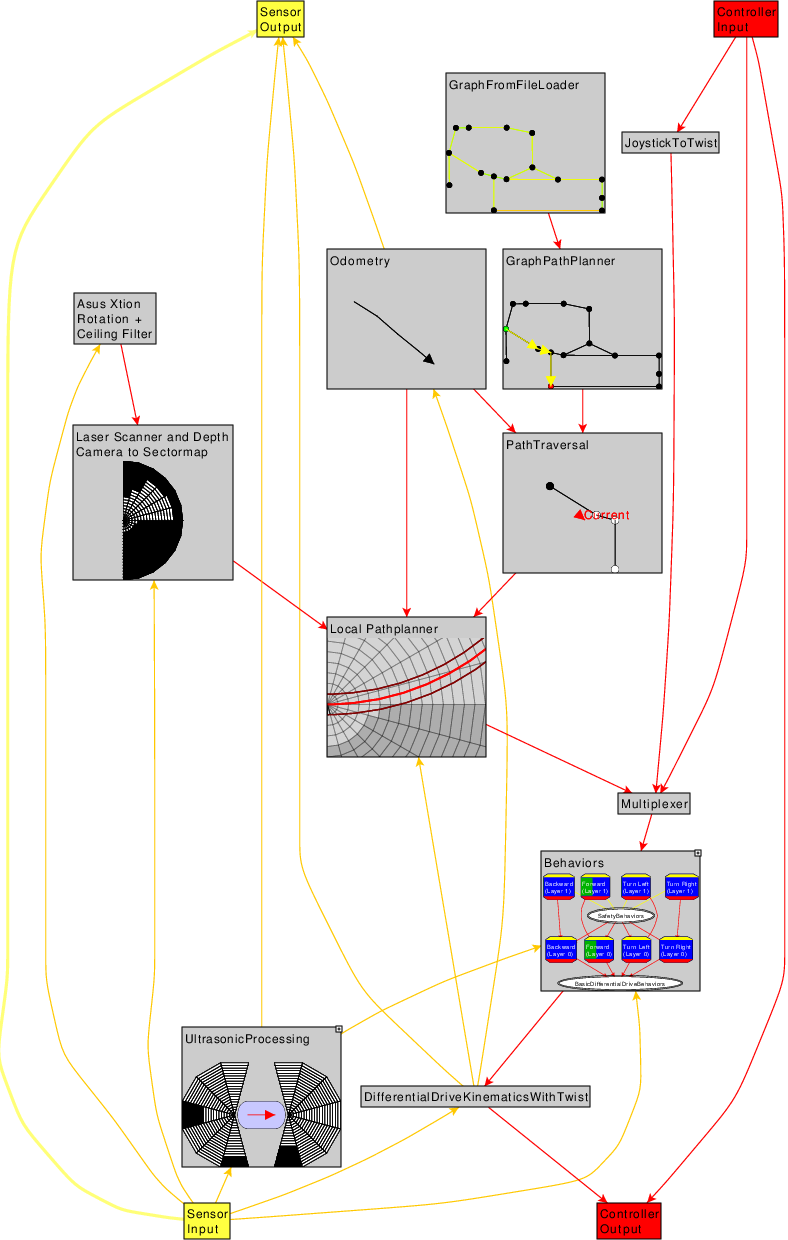
The idea of component-defined visualization is that each component provides a visualization that should – as tellingly as possible – illustrate its current state and what it is doing.
This visualization is shown in Finstruct's Component-Defined Visualization View that displays a fully-animated component graph. The advantages of this approach are discussed in the paper On the Benefits of Component-Defined Real-Time Visualization of Robotics Software.
Example
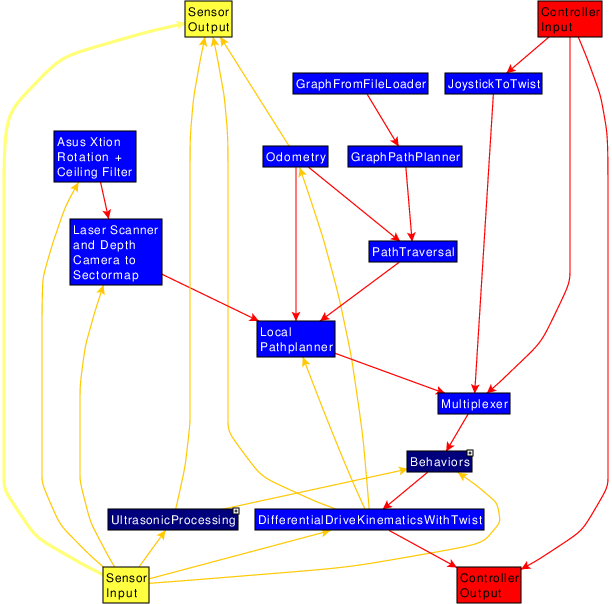
This is e.g. ARTOS' main control group. On the left, it is displayed as standard component graph. On the right is a screenshot from the (animated) component-defined visualization view.
Basics
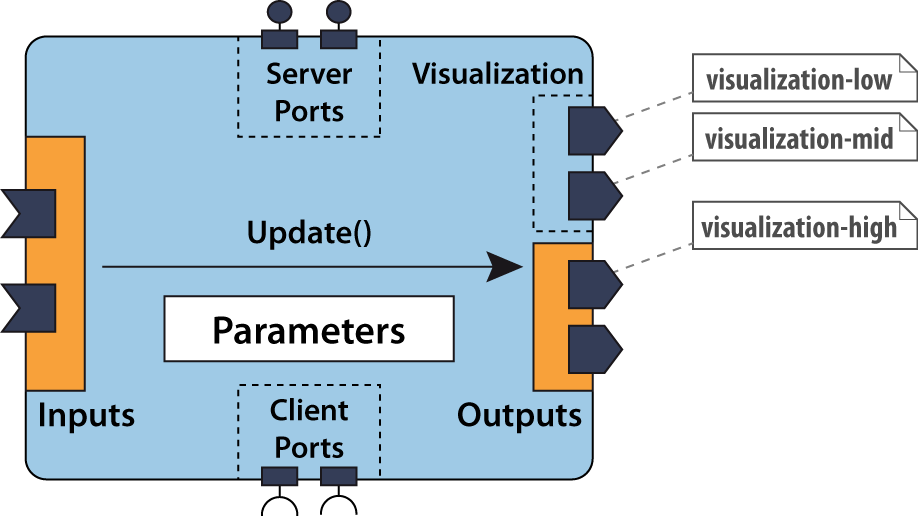
Components provide visualization data via output ports. These can be existing outputs (data the component is providing anyway) or dedicated visualization outputs (tVisualizationOutput class).
Furthermore, visualization data can be provided in up to three level of details Low, Middle, and High - in order not to consume too many resources if components e.g. have high resolution bitmap outputs. If multiple level of details are provided, tools will choose the most suitable one.
enum class tLevelOfDetail : int
{
  LOW,          //<! Suitable for low setting (up to 80x60 pixel)
  MID,          //<! Suitable for medium setting (up to 200x150 pixel)
  HIGH,         //<! Suitable for high setting (max. details)

  ALL,          //<! Suitable for all levels
  MID_AND_HIGH, //<! Suitable for high and medium setting
  LOW_AND_MID   //<! Suitable for low and medium setting
};

Currently images (tImage class) and vector graphics (tCanvas2D class) are supported as visualization data in Finstruct. It is planned to support further types in the future.
Tip
For tCanvas2D the SetViewPort() method defines the area that is shown in Finstruct.
Adding visualization output to a component
This is a simple example of how to add visualization output to a Finroc component.
Suppose, we have a component mImageProcessor that processes (transforms) images. This is its interface:
class mImageProcessor : public finroc::structure::tModule
{

//----------------------------------------------------------------------
// Ports (These are the only variables that may be declared public)
//----------------------------------------------------------------------
public:

  tInput<rrlib::coviroa::tImage> input_image;
  tOutput<rrlib::coviroa::tImage> output_image;
Now, the resulting images should be displayed in the component graph.
To achieve this, merely the following line needs to be added to the component's constructor:
The output might be high resolution images consuming significant network bandwidth. Therefore, dedicated visualization outputs publishing thumbnails of these images can be added to the component's interface:
//----------------------------------------------------------------------
// Ports (These are the only variables that may be declared public)
//----------------------------------------------------------------------
public:

  tInput<rrlib::coviroa::tImage> input_image;
  tOutput<rrlib::coviroa::tImage> output_image;

  /*! Visualization ports with thumbnails */
  tVisualizationOutput<rrlib::coviroa::tImage, tLevelOfDetail::LOW> low;
  tVisualizationOutput<rrlib::coviroa::tImage, tLevelOfDetail::MID> mid;
To publish thumbnails, adding the following code to the component's Update() method is sufficient.
  // This include is required: "rrlib/component_visualization/thumbnails.h"
  if (this->low.IsConnected())
  {
    auto output_buffer = this->low.GetUnusedBuffer();
    rrlib::component_visualization::CreateThumbnail(image, *output_buffer, 0, 60);
    this->low.Publish(output_buffer);
  }
  if (this->mid.IsConnected())
  {
    auto output_buffer = this->mid.GetUnusedBuffer();
    rrlib::component_visualization::CreateThumbnail(image, *output_buffer, 0, 150);
    this->mid.Publish(output_buffer);
  }
Note that checking the IsConnected() method on visualization output ports is essential. It is possible to entirely disable component-defined visualization (--disable-component-visualization command line option). In this case, tVisualizationOutput ports will not be created (and using them would crash the program). IsConnected() will return false in this case. Furthermore, creating additional visualization data causes some computational overhead that is unnecessary when there are no subscribers.
This works very much in the same way for vector-based visualization data.

